Live Chart Example
SteelyRangeEdge In Action
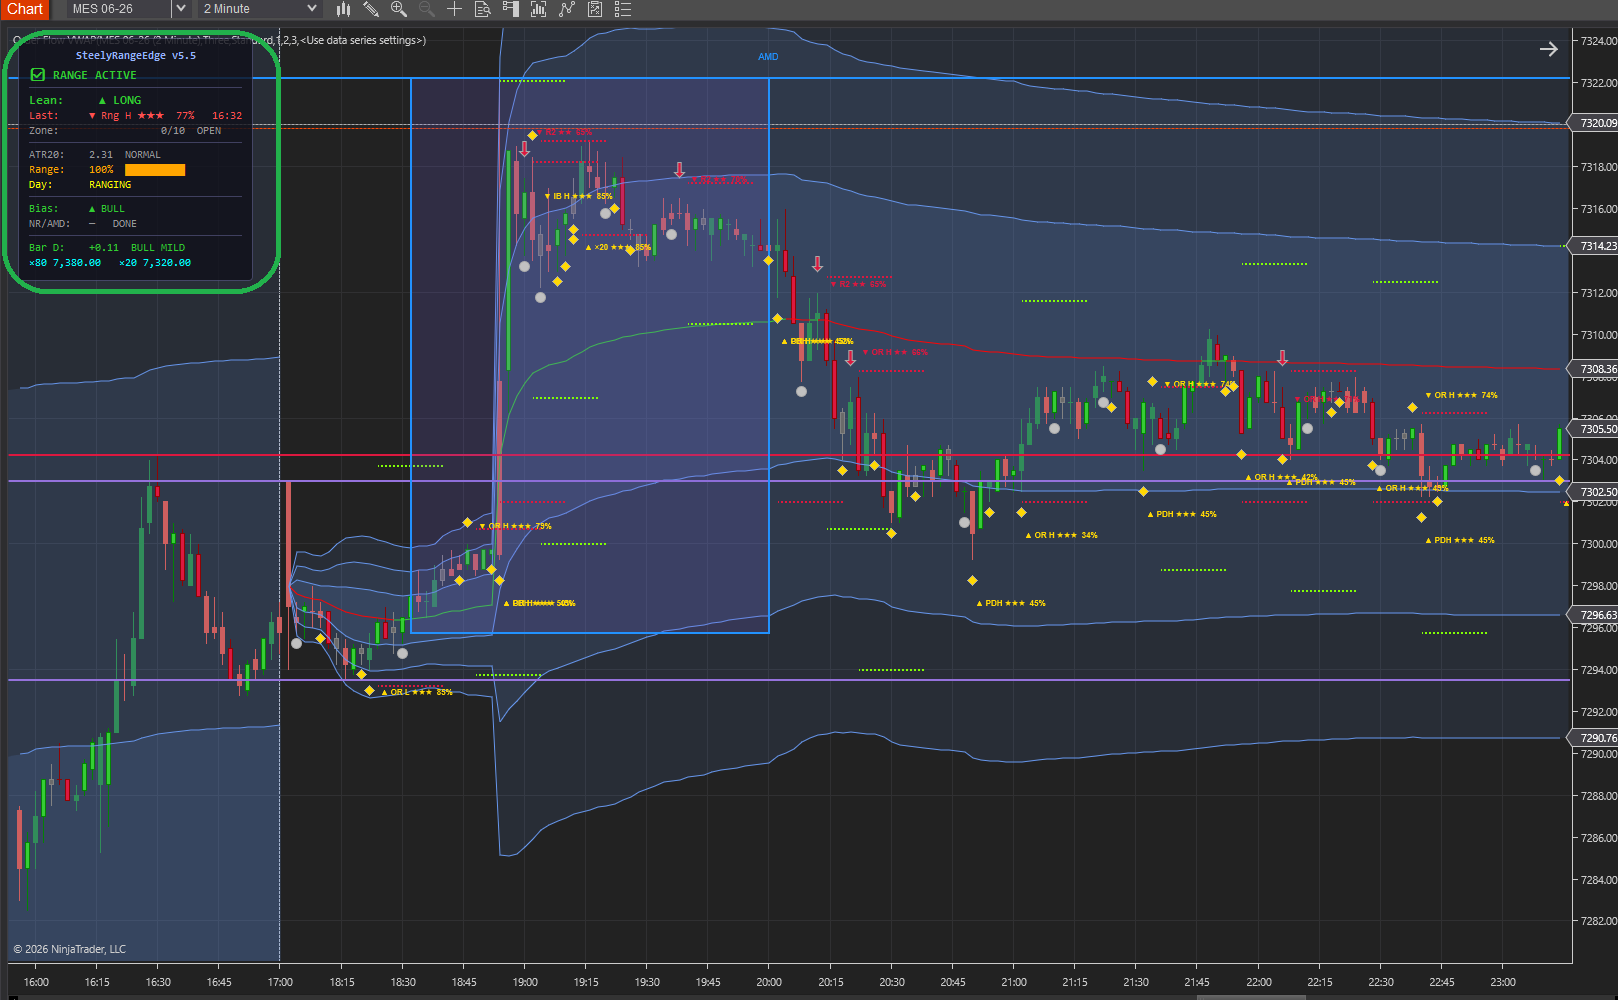
Real chart screenshot showing the indicator in a live NinjaTrader 8 session.
Others show you the levels. SteelyRangeEdge scores them. Every key level on the chart, ranked by how much the market actually respects it — fused into a single edge-probability number on every signal. So you know not just where price is, but whether the level will hold.
Real chart screenshot showing the indicator in a live NinjaTrader 8 session.
Most level indicators draw lines and stop there — leaving you to guess which of fifteen overlapping levels is worth trading. SteelyRangeEdge does the ranking for you.
Draws prior-day levels, pivots, CPR, and ranges.
Treats every level equally — a minor pivot looks the same as a prior-week high.
Leaves you to eyeball confluence and guess whether the level will hold.
It rewards traders who want to know which of the dozen levels on their chart actually matters right now.
SteelyRangeEdge maps the entire structural landscape of the trading day — prior-day levels, pivots, CPR, initial balance, opening range, overnight extremes, weekly and intraday higher-timeframe levels, and 80/20 handle rotations — then watches how price interacts with all of them.
When price tests a level, it runs a two-bar confirmation check and scores the setup against an evidence-based probability model. The result is a clean fade, breakout, or reversal signal with a real percentage attached — "this IB-High short has a 78% edge given current conditions."
A live HUD synthesizes the whole picture — directional lean, the strongest level near price, nearest higher-timeframe wall, and rotation odds — into a single decision panel. It runs fully standalone: standard data feed, no add-ons, no companion indicators required.
Important Notice: This indicator is a non-customized charting tool provided for educational and informational market analysis only. It highlights conditions that meet proprietary analytical criteria and does not constitute financial advice, trading recommendations, or a solicitation to buy or sell any instrument. All signal output is analytical in nature. Users remain solely responsible for whether, when, and how they trade. Past performance of any analytical method is not indicative of future results.
For index-futures day traders who trade levels — reversals, fades, breakouts, and rotations — and want every level pre-ranked by probability rather than treated equally.
A minimum-probability threshold and bias filter suppress low-edge, counter-trend noise — so the signals that print are the ones worth acting on.
The density heatmap and 0–10 zone score show where price can run freely and where it's heading into a wall — well before any signal prints.
When price sweeps an ×80 or ×20 level, a projected ray draws to the opposite target with a real completion probability attached to the move.
SteelyRangeEdge ranks every level on your chart by how much the market actually respects it — and puts a real edge percentage on every signal. The difference between a chart full of lines and a chart that ranks which levels matter.